Amazon CloudWatch is a monitoring and management service that provides data and actionable insights for AWS, hybrid, and on-premises applications and infrastructure resources.
CloudWatch provides you with data and actionable insights to monitor your applications, respond to system-wide performance changes, and optimize resource utilization. CloudWatch collects monitoring and operational data in the form of logs, metrics, and events. You get a unified view of operational health and gain complete visibility of your AWS resources, applications, and services running on AWS and on-premises. You can use CloudWatch to detect anomalous behavior in your environments, set alarms, visualize logs and metrics side by side, take automated actions, troubleshoot issues, and discover insights to keep your applications running smoothly.
Benefits of CloudWatch:
- Use a single platform for observability –
- Modern applications, such as those running on microservices architectures, generate large volumes of data in the form of metrics, logs, and events.
- Amazon CloudWatch allows you to collect, access, and correlate this data on a single platform from across all your AWS resources, applications, and services running on AWS and on-premises, helping you break down data silos to gain system-wide visibility and quickly resolve issues.
- Collect metrics on AWS and on premises–
- Monitoring your AWS resources and applications is easy with CloudWatch. It natively integrates with more than 70 AWS services, such as Amazon EC2, Amazon DynamoDB, Amazon S3, Amazon ECS, Amazon EKS, and AWS Lambda.
- It automatically publishes detailed one-minute metrics and custom metrics with up to one-second granularity so you can dive deep into your logs for additional context. You can also use CloudWatch in hybrid environments by using the CloudWatch Agent or API to monitor your on-premises resources.
- Collect metrics on AWS and on premises-
- Set alarms and automate actions based on predefined thresholds or on machine learning (ML) algorithms that identify anomalous behavior in your metrics.
- For example, you can start Amazon EC2 Auto Scaling automatically or stop an instance to reduce billing overages. You can also use CloudWatch Events for serverless to trigger workflows with services like AWS Lambda, Amazon SNS, and AWS CloudFormation.
- Get operational visibility and insight-
- To optimize performance and resource utilization, you need a unified operational view, real-time granular data, and historical reference.
- CloudWatch provides automatic dashboards, data with one-second granularity, and up to 15 months of metrics storage and retention.
- You can also perform metric math on your data to derive operational and utilization insights; for example, you can aggregate usage across an entire fleet of EC2 instances.
- Derive actionable insights from logs-
- Explore, analyze, and visualize your logs so you can troubleshoot operational problems with ease. With CloudWatch Logs Insights, you pay only for the queries you run.
- It scales with your log volume and query complexity, giving you answers in seconds.
- In addition, you can publish log-based metrics, create alarms, and correlate logs and metrics together in CloudWatch Dashboards for complete operational visibility.
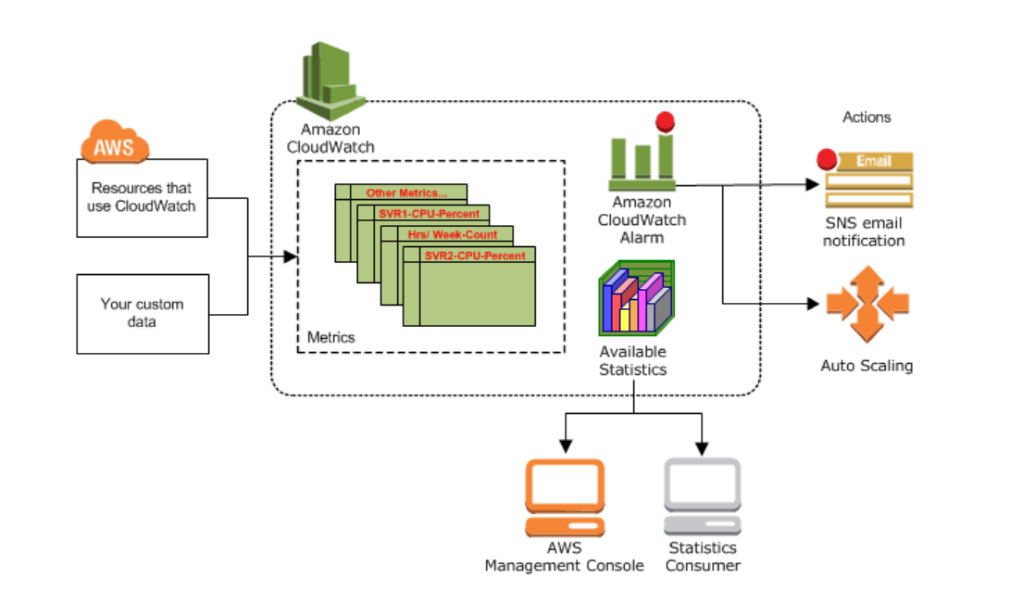
How it works
CloudWatch collects monitoring and operational data in the form of logs, metrics, and events, and visualizes it using automated dashboards so you can get a unified view of your AWS resources, applications, and services that run on AWS and on premises. You can visualize the experience of your application end users and validate design choices through experimentation. Correlate your metrics and logs to better understand the health and performance of your resources. Create alarms based on metric value thresholds you specify, or alarms that can watch for anomalous metric behavior based on ML algorithms. For example, set up automated actions to notify you if an alarm is triggered and automatically start auto scaling to help reduce mean time to resolution (MTTR).
You can use CloudWatch to collect and track metrics, which are variables you can measure for your resources and applications.
The CloudWatch home page automatically displays metrics about every AWS service you use. You can additionally create custom dashboards to display metrics about your custom applications, and display custom collections of metrics that you choose.
You can create alarms that watch metrics and send notifications or automatically make changes to the resources you are monitoring when a threshold is breached. For example, you can monitor the CPU usage and disk reads and writes of your Amazon EC2 instances and then use that data to determine whether you should launch additional instances to handle increased load. You can also use this data to stop under-used instances to save money.

Use cases-
- Monitor and troubleshoot infrastructure
- Monitor key metrics and logs, visualize your application and infrastructure stack, create alarms, and correlate data to understand and resolve the root cause of performance issues in your AWS resources.
- This includes monitoring your container ecosystem across Amazon ECS, AWS Fargate, Amazon EKS, and Kubernetes.
- Improve mean time to resolution
- Correlate, visualize, and analyze metrics and logs so you can resolve issues quickly, and combine them with trace data from AWS X-Ray for full observability.
- You can also analyze user requests to speed up troubleshooting and debugging, and reduce overall MTTR.
- Optimize resources proactively
- CloudWatch alarms watch your metric values against thresholds that you specify or that it creates using ML models to detect anomalous behavior.
- If an alarm is triggered, CloudWatch can act automatically to enable Amazon EC2 Auto Scaling or stop an instance, so you can automate capacity and resource planning.
- Monitor applications
- Monitor your end user’s digital experience and your applications that run on AWS (on Amazon EC2, containers, and serverless) and on-premises.
- CloudWatch collects data at every layer of the performance stack, from your frontend to your infrastructure.
- You can use ServiceLens to identify performance bottlenecks in your applications and isolate them using the correlated metrics, logs, and traces. Add canaries for SLA/SLO monitoring of endpoints and UI workflows.
- Collect client-side data on application performance in near real time to identify and debug issues that impact end users. Experiment with features across the full application stack, measure against performance and business metrics, and launch features safely.
- Use observability analytics
- Analyze millions of operational logs and metrics in near real time to identify trends and patterns in your application performance, and use these insights to reduce MTTR.
- Use fast and interactive operational queries to create powerful visualizations, helping you monitor and pinpoint issues quickly.
The following terminology and concepts are central to your understanding and use of Amazon CloudWatch:
- Namespaces – A namespace is a container for CloudWatch metrics. Metrics in different namespaces are isolated from each other, so that metrics from different applications are not mistakenly aggregated into the same statistics.
- Metrics – Metrics are the fundamental concept in CloudWatch. A metric represents a time-ordered set of data points that are published to CloudWatch.
- Metrics exist only in the Region in which they are created. Metrics cannot be deleted, but they automatically expire after 15 months if no new data is published to them.
- Dimensions – A dimension is a name/value pair that is part of the identity of a metric. You can assign up to 30 dimensions to a metric.
- Every metric has specific characteristics that describe it, and you can think of dimensions as categories for those characteristics. Dimensions help you design a structure for your statistics plan.
- Resolution – Each metric is one of the following:
- Standard resolution, with data having a one-minute granularity
- High resolution, with data at a granularity of one second
- Metrics produced by AWS services are standard resolution by default. When you publish a custom metric, you can define it as either standard resolution or high resolution.
- Statistics – Statistics are metric data aggregations over specified periods of time. CloudWatch provides statistics based on the metric data points provided by your custom data or provided by other AWS services to CloudWatch.
- Percentiles – A percentile indicates the relative standing of a value in a dataset. For example, the 95th percentile means that 95 percent of the data is lower than this value and 5 percent of the data is higher than this value. Percentiles help you get a better understanding of the distribution of your metric data.
- Alarms – You can use an alarm to automatically initiate actions on your behalf. An alarm watches a single metric over a specified time period, and performs one or more specified actions, based on the value of the metric relative to a threshold over time. The action is a notification sent to an Amazon SNS topic or an Auto Scaling policy. You can also add alarms to dashboards.
